VSCode provides out of box support for debugging JS variants. To debug languages like C/C++, though, you’d need to do a little preparation job yourself.
To be clear, VSCode itself as a lightweight IDE, does not come with complier and debugger, so you need to install GCC on your computer first. I’m writing this on a Windows 10 machine, where the MinGW-GCC suite has been installed.
Make sure you have your complier and debugger ready before you move on.
Create Build Task
VSCode uses the concept of Task for its automation, including automating the build task we need.
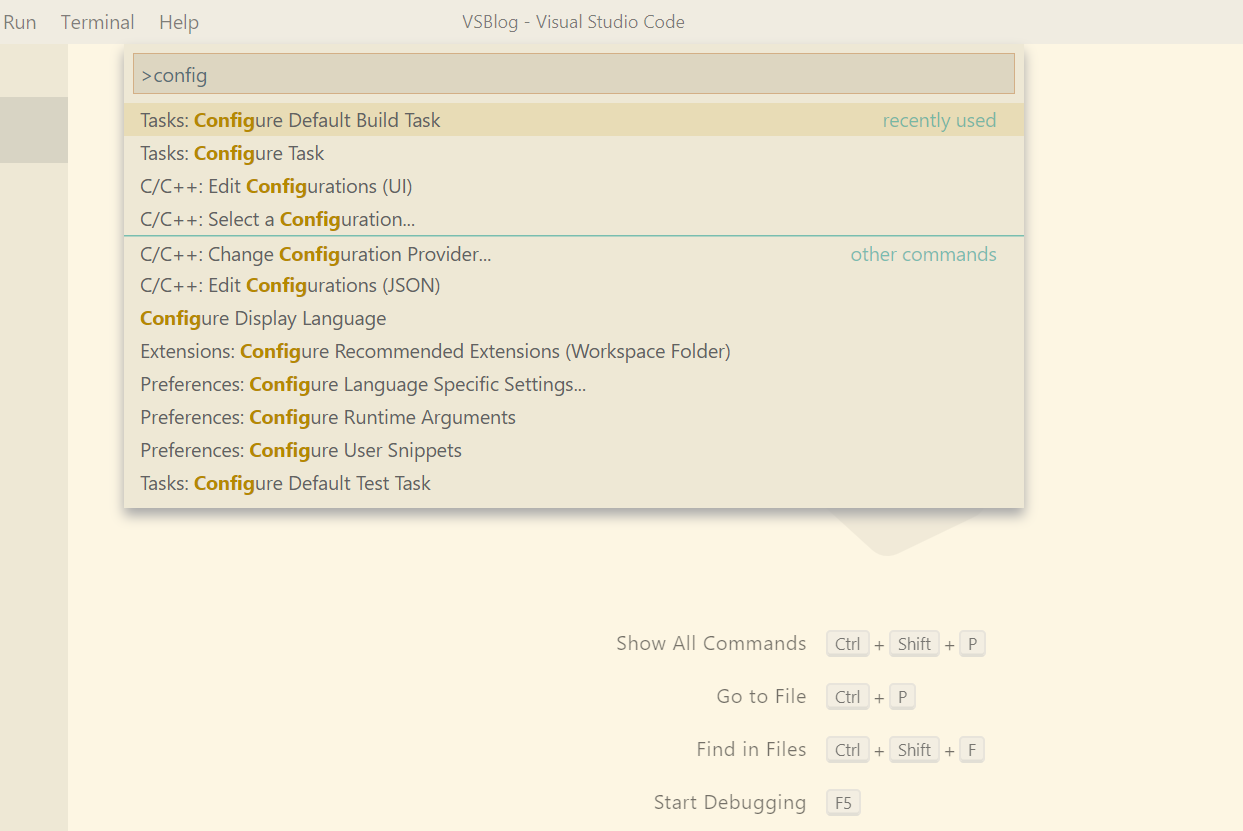
If you have never used task before, you can simply create the task configuration file (named tasks.json) via the command palette in VSCode (Ctrl + Shift + P to open the palette) .
Type in “config”, and choose Configure Default Build Task (or Configure Task if you do not want this C++ build task we’re about to create to be your default build task. It doesn’t really matter. In fact, you’ll still be asked to pick which build task to use later, even if you create the build task as a default…)
Then choose Create tasks.json file from template -> Others(since we are using GCC, not MSBD).
You may have spotted a
C/C++:Edit Configurationsoption. It’s another configuration file related to C/C++, where you can fine tune some advanced settings to improve your C/C++ workflow. We don’t need it for this post, though.
A configuration file named tasks.json is now created for you in your .vscode folder (located at your current workspace folder). It’s also opened up for editing:
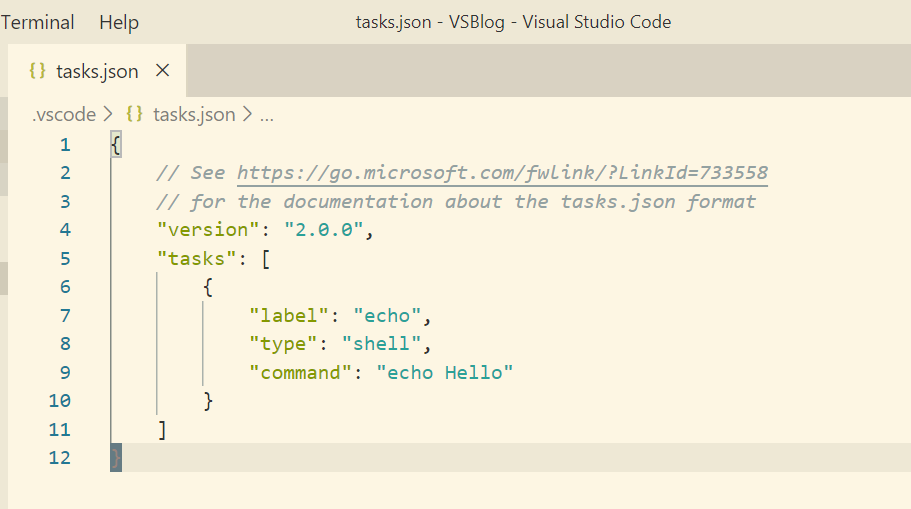
Currently the file doesn’t have much in it but we can have a look at the core elements of a custom task. From the official docs:
The task’s properties have the following semantic:
- label: The task’s label used in the user interface.
- type: The task’s type. For a custom task, this can either be
shellorprocess. Ifshellis specified, the command is interpreted as a shell command (for example: bash, cmd, or PowerShell). Ifprocessis specified, the command is interpreted as a process to execute.- command: The actual command to execute.
So our task is labelled “echo”, and all it does is run shell command “echo Hello”.
You can try running it via command palette: Run Task -> echo:

Normally you’d build a C/C++ project via CLI, so a shell task is exactly what we want here.
We just need to change the actual command it runs so that it execute your usual build command, instead of echoing “Hello”.
In my case I’m using makefile, and I’ve also added the cwd option to make sure it run the command in the folder where my active c++ file sits. So my tasks.json looks like this:
{
    "version": "2.0.0",
    "tasks": [
        {
            "label": "make",
            "type": "shell",
			"options": {
                "cwd": "${fileDirname}"
            }
            "command": "mingw32-make"
        }
    ]
}
Now you can run the task make via command palette like you just did with echo, and the task will run the mingw32-make command for you.
As a side note, you can create so many kind of tasks for automation. See the official docs for more details. For example, you can create a clean task as well to run make clean for you. All the tasks are put in your tasks.json:
{
    "version": "2.0.0",
    "tasks": [
        {
            "label": "make",
            "type": "shell",
            "options": {
                "cwd": "${fileDirname}"
            },
            "command": "mingw32-make",
        },
        {
            "label": "clean",
            "type": "shell",
            "options": {
                "cwd": "${fileDirname}"
            },
            "command": "ming32-make clean"
        }
    ]
}
Making It Default
If your make task is set to your default build task, you can run it more easily with Ctrl + Shift + b.
To configure your make task as the default build task, you just need to try Ctrl + Shift + b and VSCode will ask you to specify a default build the first time you use the shortcut.
Choose the make task we just created to be the default. You’ll see that all it does is to add some new information in your make task in the tasks.json file:
{
    "version": "2.0.0",
    "tasks": [
        {
            "label": "make",
            "type": "shell",
            "command": "mingw32-make",
            "options": {
                "cwd": "${fileDirname}"
            },
            "problemMatcher": [],
            "group": {
                "kind": "build",
                "isDefault": true
            }
        },
        {
            "label": "clean",
            "type": "shell",
            "command": "ming32-make clean"
        }
    ]
}
The problemMatcher entry is beyond the scope of this post (again read the docs, it allows you to do some super cool stuff), we just leave it blank. The group entry, as the name suggests, puts your task into a group, and, in our case, set it to the default task for that build group.
Now if you press Ctrl + Shift + b , VSCode looks at the tasks.json file, find the tasks in build group, and run the isDefault one. Effectively, it runs your make task to build.
Debug
As mentioned above, VSCode supports debugging JS out of box. For other languages, you need to install an extension first:
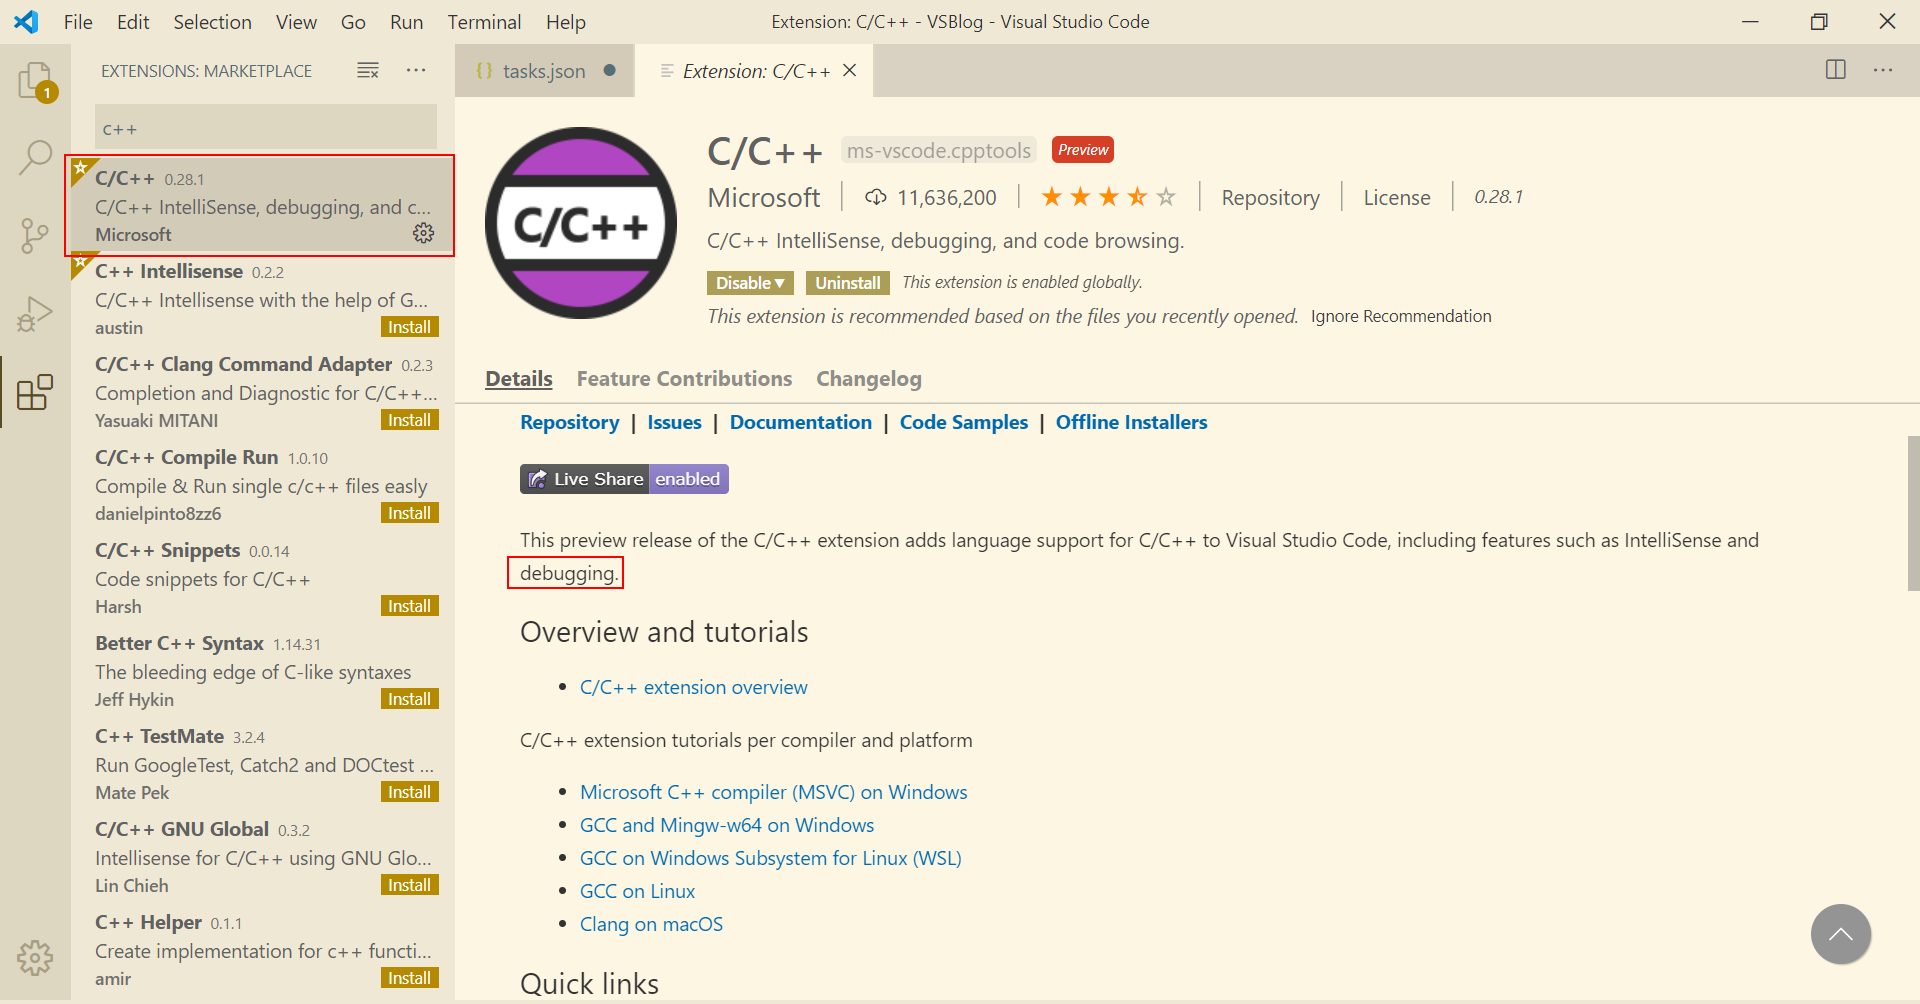
Now if you go to Run-> Start Debugging (or F5), you’ll be asked to choose an environment. Select the C++ (GDB/LLDB) one. I think this template comes with the C++ extension you just installed.
This time, a launch.json file is created for you in your .vscode folder. The file itself is also open for editing:
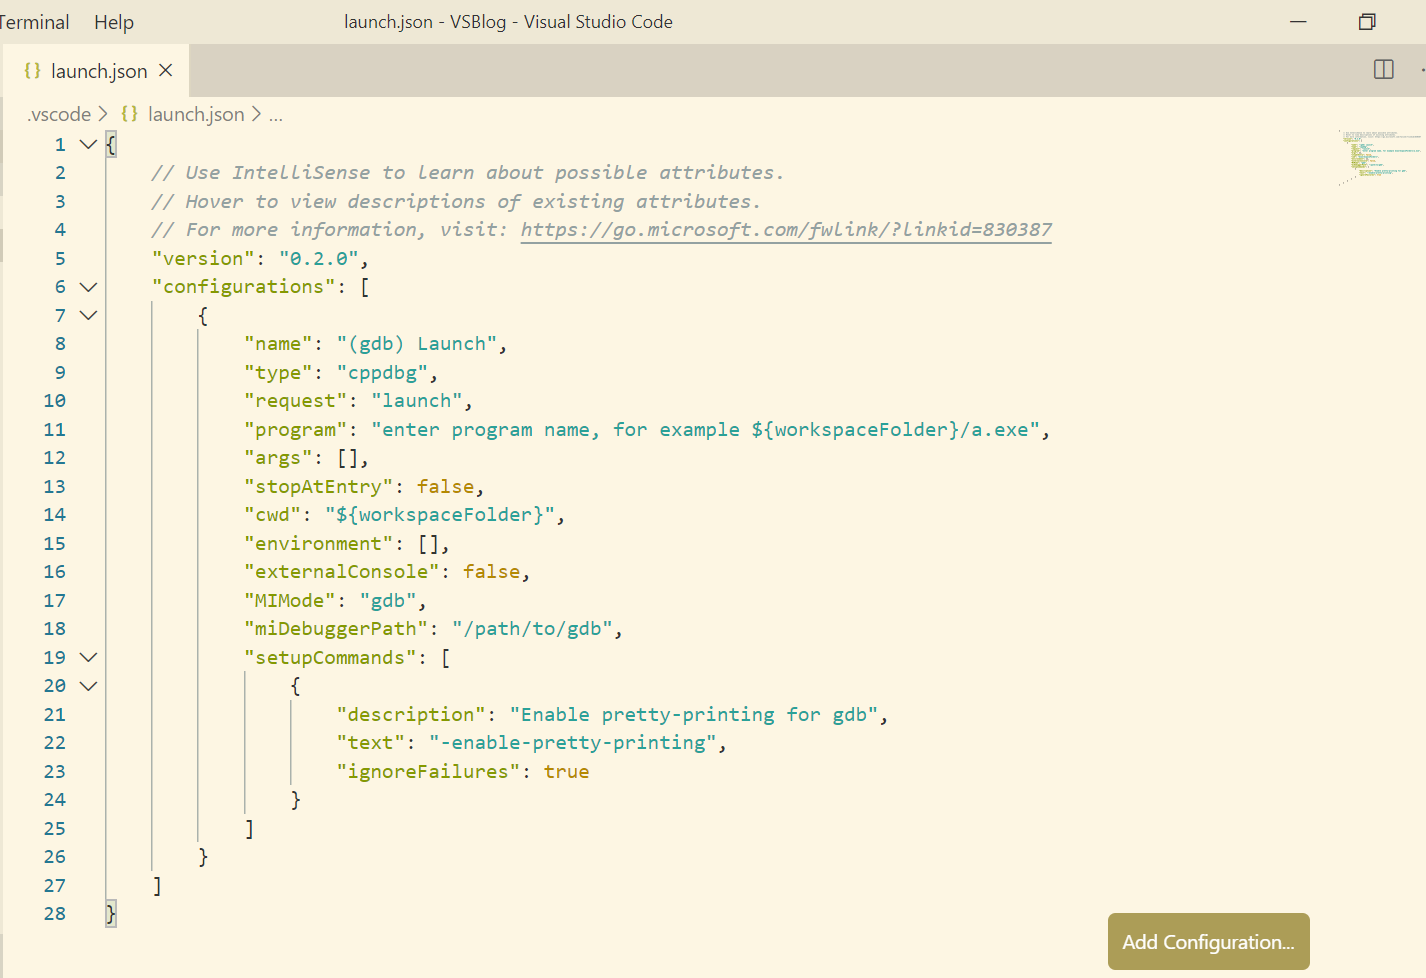
Looks intimidating. But you can keep most of them as default. For example, for request entry, you can specify either you want to launch or attach your debugger. For our C++ program, we’re happy to let the debugger launch the program for us.
The most interesting entries are:
program, where you give the path to the program you want to launch to debug.args, where you specify arguments for your program, if neededmiDebuggerPath, where you give the path to your gdb.exe. As mentioned above, you need to install GCC suite yourself, and your gdb probably will be sitting at somewhere likeC:\gcc\bin\gdb.exe.
Once you specify the programs you want to debug, and your debugger. You can start debugging with F5!
There is another entry you can add to the launch.json, called preLaunchTask. Yup, you guessed right, it will automatically run a task before launching the debugger. It’s very useful if you put your make task here, so that it will rebuild the project before debugging starts.
My launch.json looks like this:
{
    "version": "0.2.0",
    "configurations": [
    {
        "name": "gdb (Launch)",
        "type": "cppdbg",
        "request": "launch",
        "program": "${fileDirname}\\MyProg.exe",
        "args": [],
        "stopAtEntry":false,
        "cwd": "${fileDirname}",
        "environment": [],
        "externalConsole": false,
        "MIMode": "gdb",
        "miDebuggerPath": "C:\\gcc92\\MinGW\\bin\\gdb.exe",
        "setupCommands": [
            {
                "description": "Enable pretty-printing for gdb",
                "text": "-enable-pretty-printing",
                "ignoreFailures": true
            }
        ],
        "preLaunchTask" : "make"
    }
    ]
}
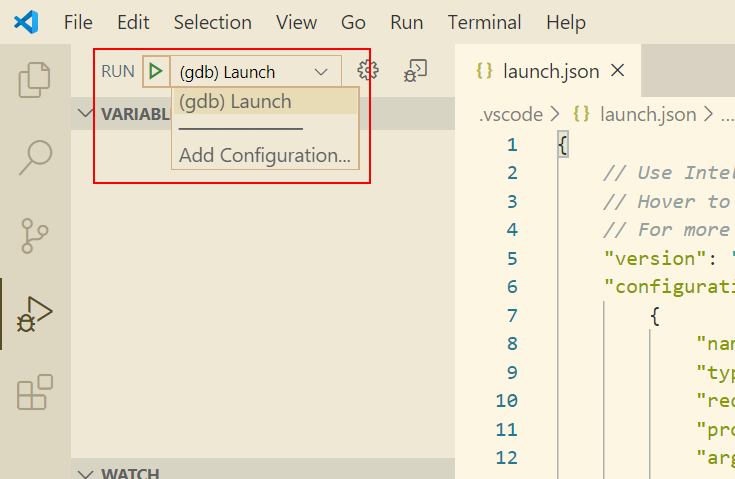
Of course, just like you can create many tasks in your tasks.json file, you can create more launch configurations, and choose different debugging environment as you like:
Important Note
I’ve forgotten this time and time again, pulling my hair, screaming at VSCode for not hitting any breakpoint in debugging:
Remember to add the debug information flag -g in your makefile (or to the build command in your build task), and remember to check if the build options are in correct order.